
The most useful hotel operations KPIs connect demand, rate, revenue, profit, labor, service delivery, and asset condition. Occupancy, ADR, and RevPAR are important, but they do not explain operating quality by themselves, so managers need a layered dashboard that shows what is driving the result.
Operations Scorecard | Track occupancy, ADR, RevPAR, total revenue, GOP or GOPPAR, labor productivity, cost per occupied room, forecast accuracy, room readiness, maintenance backlog, and guest-issue resolution. Use consistent formulas and compare actual results with budget, prior period, and a relevant competitive benchmark where available.
Begin With the Standard Rooms Metrics
STR’s hotel benchmarking guide defines three core rooms metrics: occupancy as rooms sold divided by rooms available, ADR as room revenue divided by rooms sold, and RevPAR as room revenue divided by rooms available. Those definitions are useful because they make performance comparable across periods and, when the data is aligned, across properties.
Each metric answers a different question. Occupancy shows how much available room inventory was sold. ADR shows the average room revenue associated with sold rooms. RevPAR combines rate and occupancy into one top-line rooms measure. A hotel can improve RevPAR through higher rate, stronger occupancy, or a mix of both, so the manager should always review the components.
For properties where guest satisfaction is a major diagnostic input, the tropical resort satisfaction scorecard illustrates why operational results should be paired with experience evidence rather than interpreted alone.
Add Total-Revenue and Profit Measures
A full-service hotel can generate meaningful revenue from food and beverage, meetings, parking, spa, recreation, and other departments. TRevPAR, or total revenue per available room, expands the view beyond rooms. GOPPAR then brings operating expenses into the picture by relating gross operating profit to available rooms.
HVS explains the distinction between RevPAR, TRevPAR, and GOPPAR in its discussion of hotel investment benchmarks. The practical operating lesson is that a revenue gain is not automatically a profit gain. A promotion that fills rooms but creates high distribution cost, overtime, or low-margin ancillary activity may look positive at the top line while contributing less at the profit level.
HFTP’s resources on the Uniform System of Accounts for the Lodging Industry also illustrate the importance of standardized operating and financial reporting. Properties should use the accounting definitions required by their own ownership, management, and reporting framework rather than mixing formulas from different sources.
Track Labor and Room-Delivery Efficiency
Labor is one of the largest controllable operating areas for many hotels, so the dashboard should show productivity as well as total payroll cost. Useful measures include labor hours per occupied room, housekeeping minutes per cleaned room, front-desk transactions per labor hour, overtime percentage, and schedule variance against forecast demand.
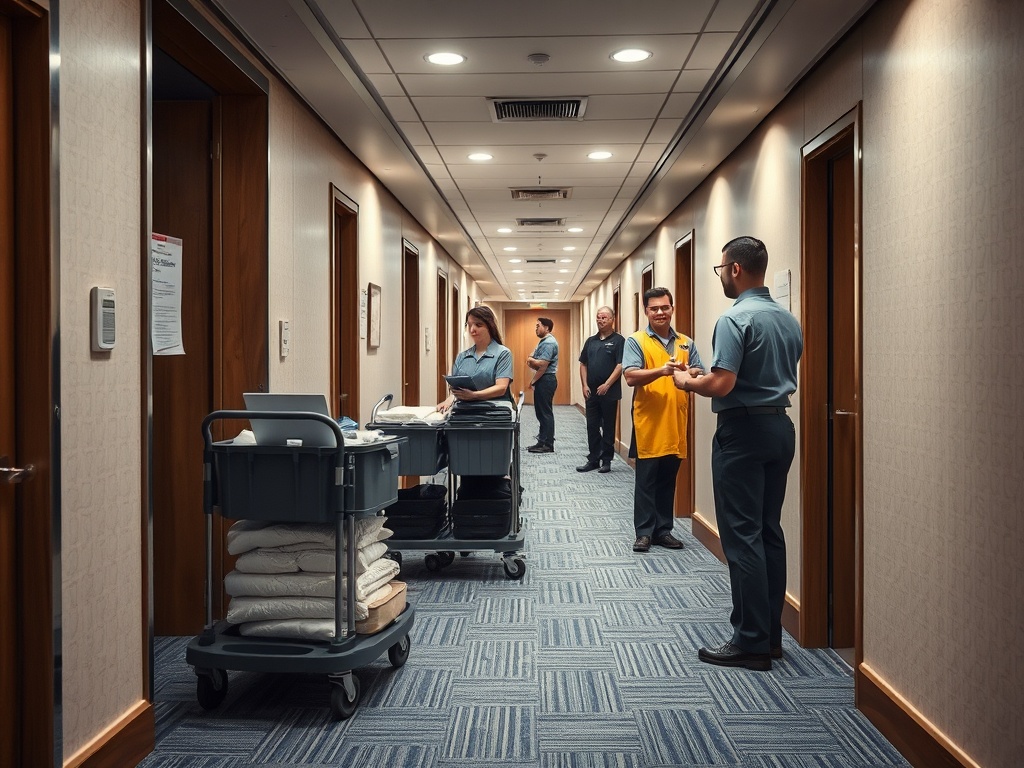
Room readiness is another operational measure with direct guest impact. Track the percentage of due-in rooms ready by the property’s target time, average turnaround time from checkout to ready status, rooms returned for re-cleaning, and out-of-order room nights. These figures help explain why arrival satisfaction or check-in queues may change.
A good operating review does not use productivity metrics to push staffing below safe or serviceable levels. The purpose is to match labor with workload, identify recurring process waste, and see where training or technology may improve the flow of work.
Monitor Maintenance Before It Becomes Guest Friction
Reactive work orders tell only part of the maintenance story. Add preventive-maintenance completion, average work-order age, repeat work orders for the same room or asset, out-of-service equipment, and the share of rooms with open defects.
A rising backlog can be an early warning even when guest complaints are still stable. Repeated plumbing, HVAC, door-lock, or lighting issues can also create hidden labor costs because engineering and housekeeping revisit the same problem.
This operational layer connects directly with hotel asset performance metrics, where owners may be evaluating capital needs, maintenance efficiency, and the effect of property condition on profit.
Use Forecast Accuracy as a Management KPI
Hotels make staffing, purchasing, inventory, and pricing decisions before final demand is known. Forecast accuracy therefore deserves a place on the dashboard. Compare forecast rooms sold, occupancy, room revenue, and major department demand with actual results at consistent lead times, such as 30 days, 14 days, 7 days, and 1 day before arrival.
A simple percentage error can be useful, but managers should also look at bias. A forecast that is consistently too high creates a different operating problem from one that is consistently too low. Review accuracy by day of week, market segment, event period, and season.
Forecast quality should be linked to decisions. If the hotel can forecast rooms sold well but repeatedly misses breakfast covers or banquet staffing, the issue may be the translation from rooms demand to department demand rather than the rooms forecast itself.
Include Service and Quality Measures
Operational quality needs direct measures. Track guest-issue cases per occupied room, first-response time, resolution time, percentage resolved before checkout, room inspection defects, housekeeping rework, and complaint themes by department. These measures are especially useful when revenue remains strong, because commercial performance can temporarily hide service strain.
For physical changes or recurring layout-related friction, use the separate guest-experience design metrics rather than assigning every issue to operations.
Read the Dashboard in Layers
A practical review sequence is demand, rate, revenue, profit, labor, room readiness, maintenance, and guest service. Start with the outcome, then move to the likely drivers. If GOPPAR falls while RevPAR rises, check labor, utilities, distribution costs, and departmental margins. If occupancy rises while room readiness falls, inspect staffing and housekeeping productivity. If guest complaints rise without a change in occupancy, look for maintenance, training, or process issues.
Avoid treating a single month as proof of a trend. Use rolling views and comparable periods, and document any change in definitions so the history remains interpretable.
Set Thresholds for Investigation, Not Automatic Judgment
Targets are helpful when they trigger a useful question. A labor measure above plan may reflect overtime, a sudden occupancy shift, or a deliberate service decision. A lower maintenance backlog may look positive but can be misleading if work orders are being closed without durable fixes. Define alert ranges for key measures and require a short diagnostic note before a corrective action is assigned.
Use rolling averages for volatile metrics and keep daily operational alerts separate from monthly management trends. This prevents teams from overreacting to a single event while still allowing urgent service or safety issues to be addressed immediately.
Build a Dashboard Managers Can Use in One Meeting
Choose a limited number of primary KPIs for the first page and keep diagnostic measures behind them. Every metric should have a formula, data owner, reporting frequency, target or comparison basis, and a clear action path when the result moves outside the expected range.
For the next operating review, confirm the formulas for occupancy, ADR, RevPAR, TRevPAR, and GOPPAR, then add three process measures that explain room readiness, labor efficiency, and guest recovery.